Web Application
Madrona comes bundled with a React.js web application that allows the user to interact with the API. A user can
discover devices, manage profiles, and start/stop/monitor running pipelines.
The landing page of the web application displays a list of devices that the user has access to.
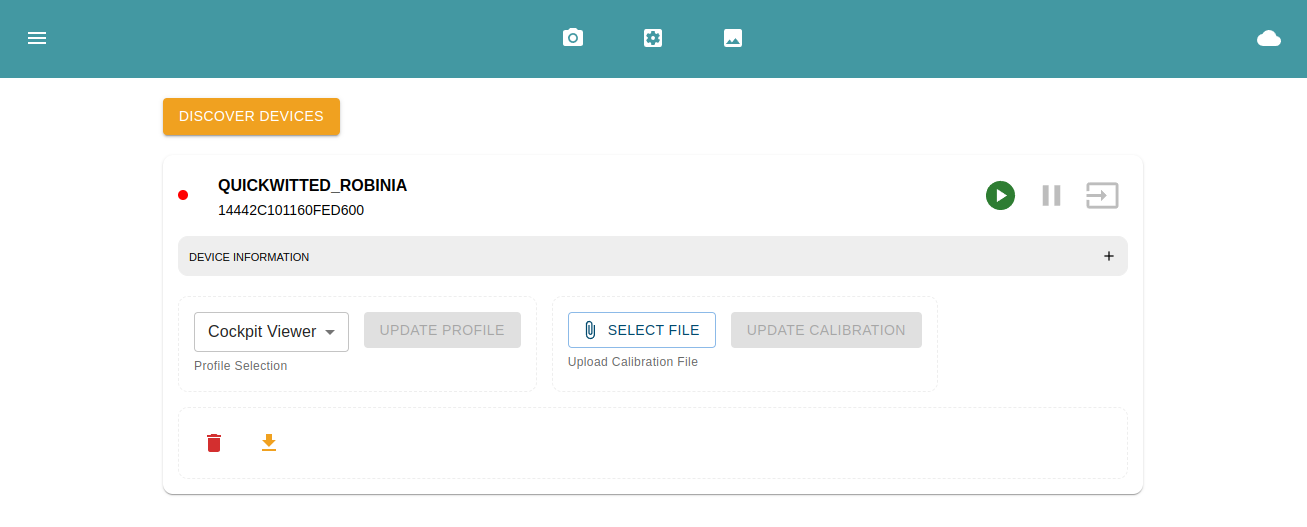
The top left menu icon will open a drawer that allows the user to navigate to the different sections of the web application.
The middle icons are the quick access navigation buttons to the different pages of the web application.
The top right cloud icon indicates if the web application is currently connected to the server. If the icon is RED, the web application is not recieving data from the server.
Device Management
On the devices page, the user can see a list of all discovered devices avaliable. Initially, the user will need to click the 'Discover Devices' button to find devices on the network.
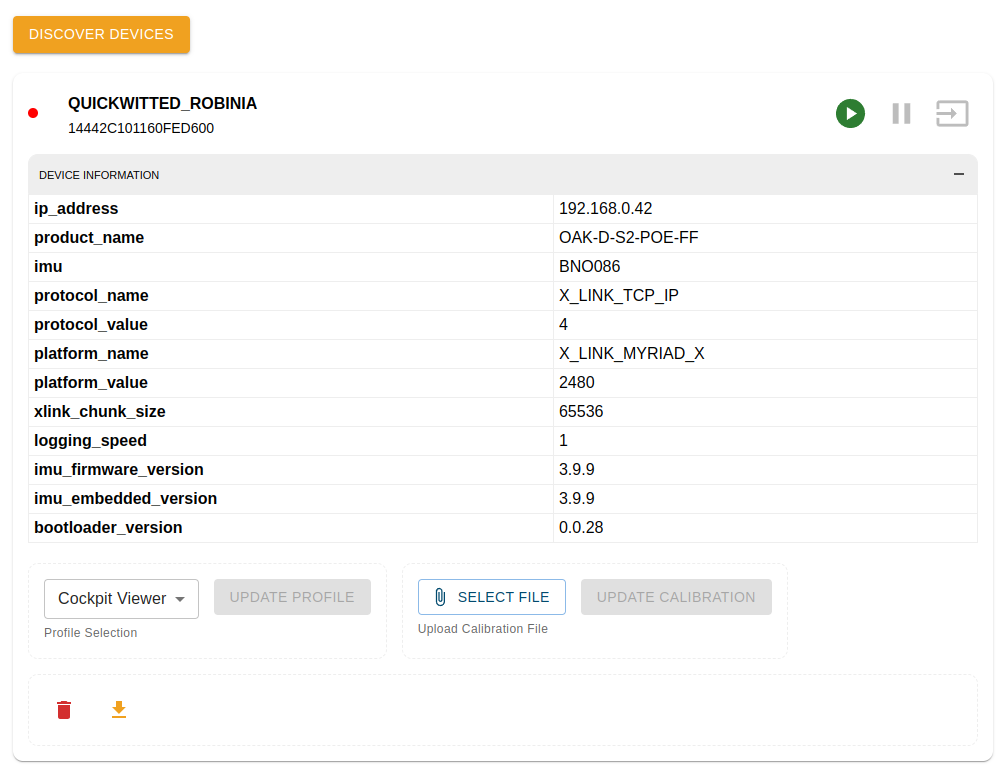
Each device displays it's uniquely generated name, MX_ID (the OAK-D unique identifier), and information such as the model, firmware versions, and related features of the device. The schema and documentation for these attributes is in the OpenAPI documentation.
The green play button can be used to quick start the pipeline, launching the selected profile and navigating to the pipeline page. If a pipeline is already running, it can be paused by clicking the red paused button. To interact with the pipeline, the user can click on the orange button to navigate to the pipeline.
At the bottom of the device card, a user can update the profile to use with the device, select a new calibration file to flash, download the current calibration, or delete the device from the database.
Next to the device name and id, there is an circular icon that indicates the status of the associated pipeline for the device. GREEN indicates the pipeline is running, RED indicates the pipeline is stopped.
Profile Management
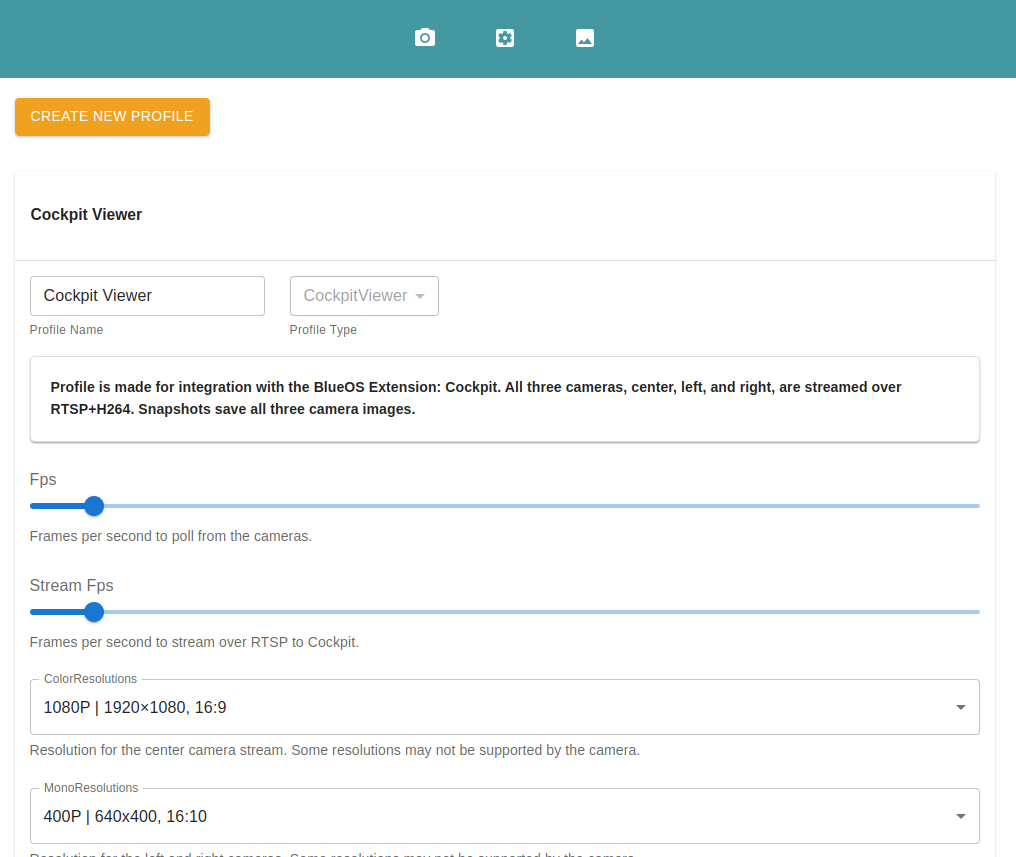
Clicking on the 'Profiles' page with the quick access icons or in the side menu will display all the profiles that are currently stored in the database. The user can create, edit, and delete profiles from this page.
These forms are automatically generated from the cooresponding JSON schema for the selected profile type.
For a running pipeline, editing a profile will only take effect after the pipeline has been restarted.
Pipeline Management
From the devices page, the user can start a pipeline by clicking the green play button on the device card. This will launch the selected profile and navigate to the pipeline.
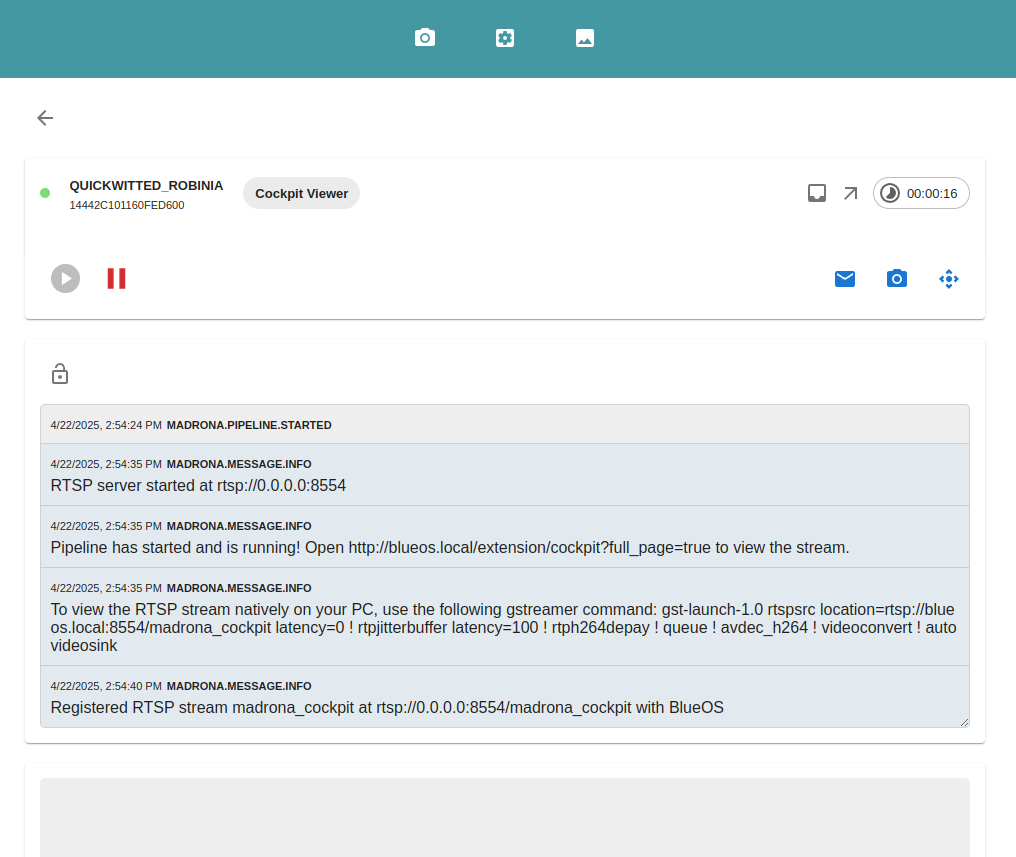
The selected profile is displayed along with the status of the pipeline: total new messages, total outgoing messages, and elapsed running time.
Depending on the interfaces a specific profile has, this view will display different interactive capabilities. In the screenshot above, the selected profile implements the snapshot interface allowing the user to capture and display snapshots from the device.
All profiles allow the user to view the active logs from the running pipeline. The logs in the screenshot above are from the snapshot interface showing all the captured snapshots.
The user can toggle the different interactive components with the icons in the bottom-right corner.
Snapshots Management
After taking snapshots, on an interval or manually from interacting with the pipeline, the user can manage them from the Snapshots tab in the navigation.
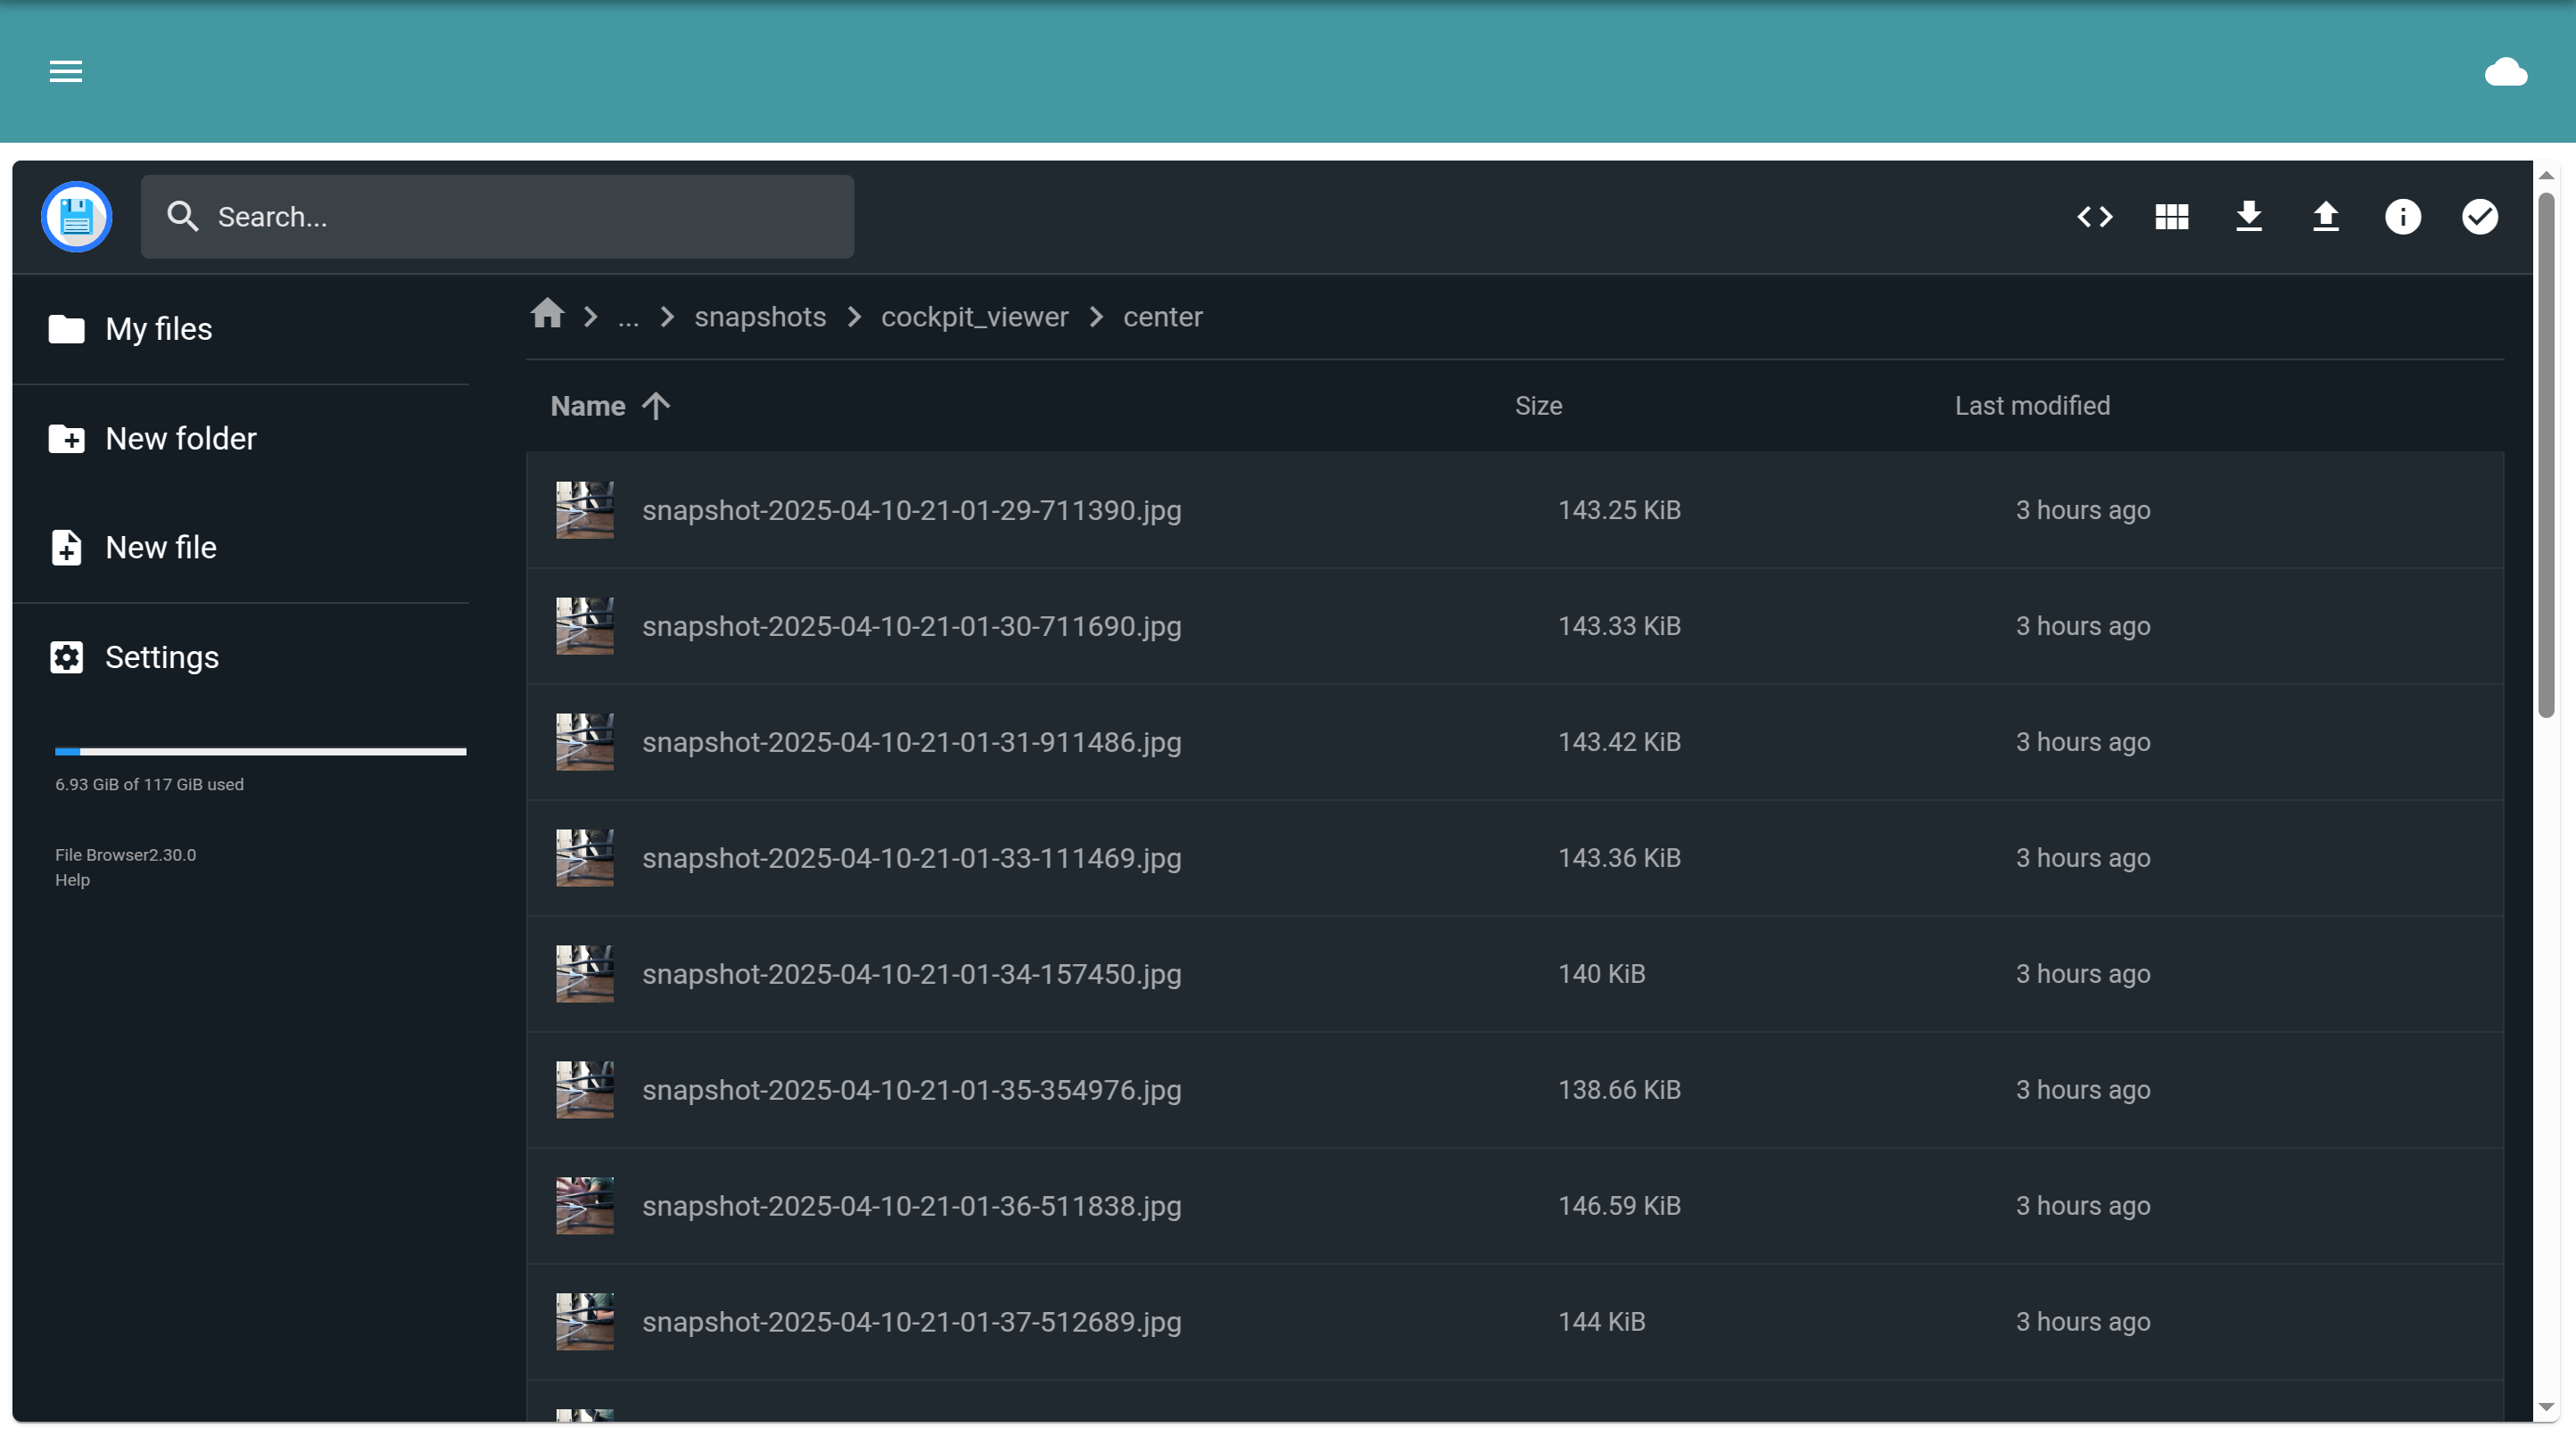
The interface is powered by Filebrowser that comes preinstalled with BlueOS. It works the same as the file browser on your computer, allowing you to view, download, and delete files.